Open Puzzle Kit 01 / free to teach and adapt
The missing anchor.
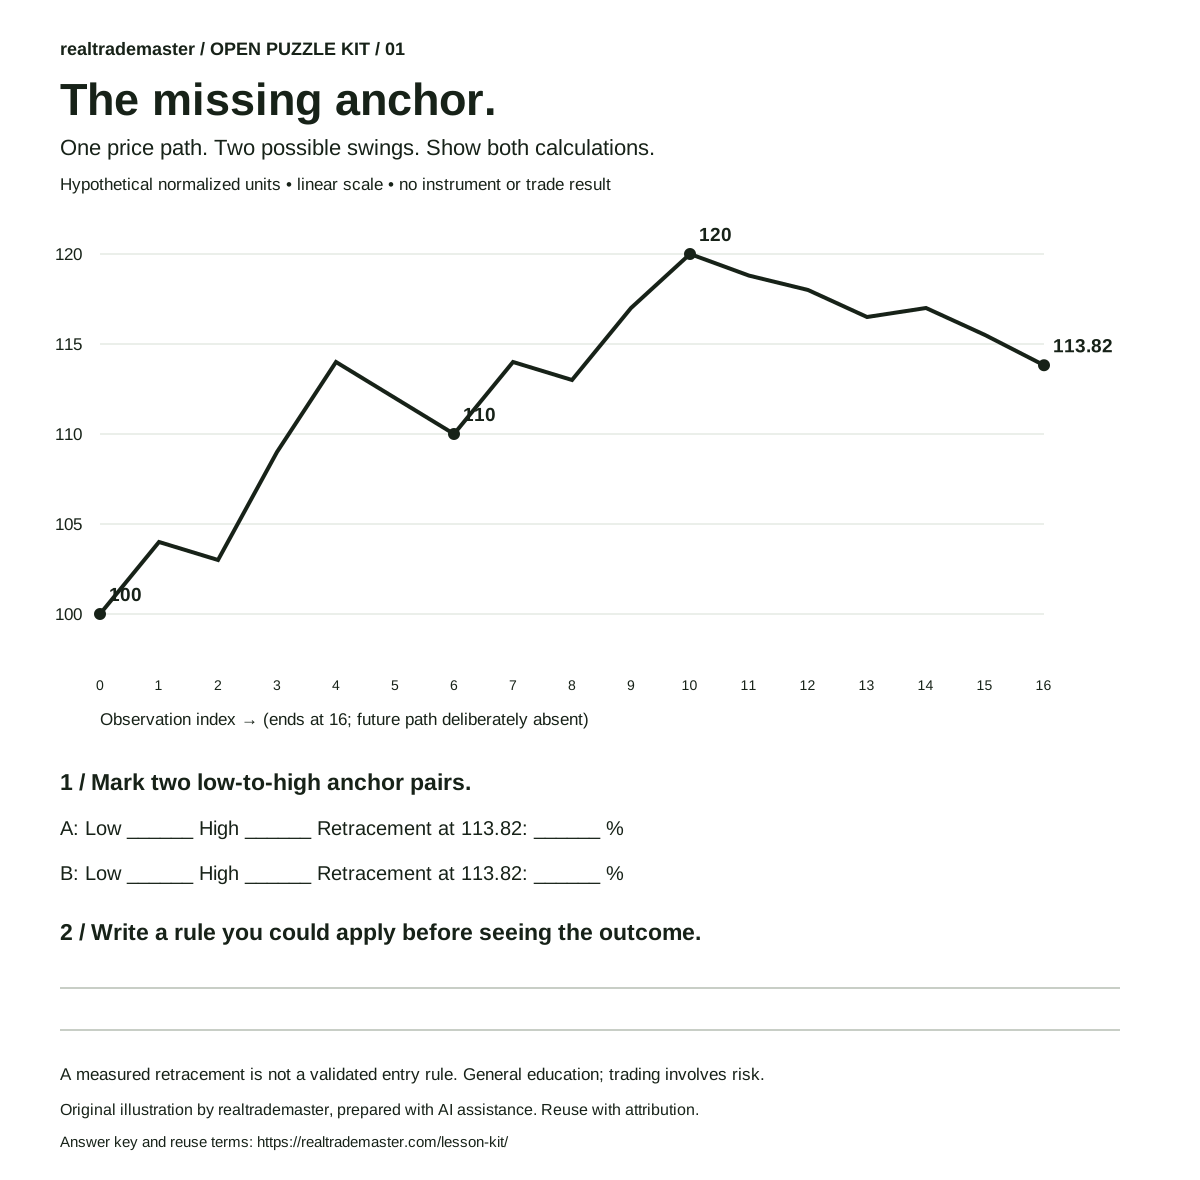
Two analysts. The same price. One says 30.9%; the other says 61.8%. Give your study group the blank chart and let them find the missing detail.
No signup. Original hypothetical data. Reuse with attribution.
Make this your next study session.
The ZIP contains a blank SVG worksheet, CSV data, an annotated chart, a facilitator guide with answers, and reuse terms. Use it in a lesson, adapt it into a video, or annotate your own version. Keep the hypothetical-data label and credit the source.
The reveal
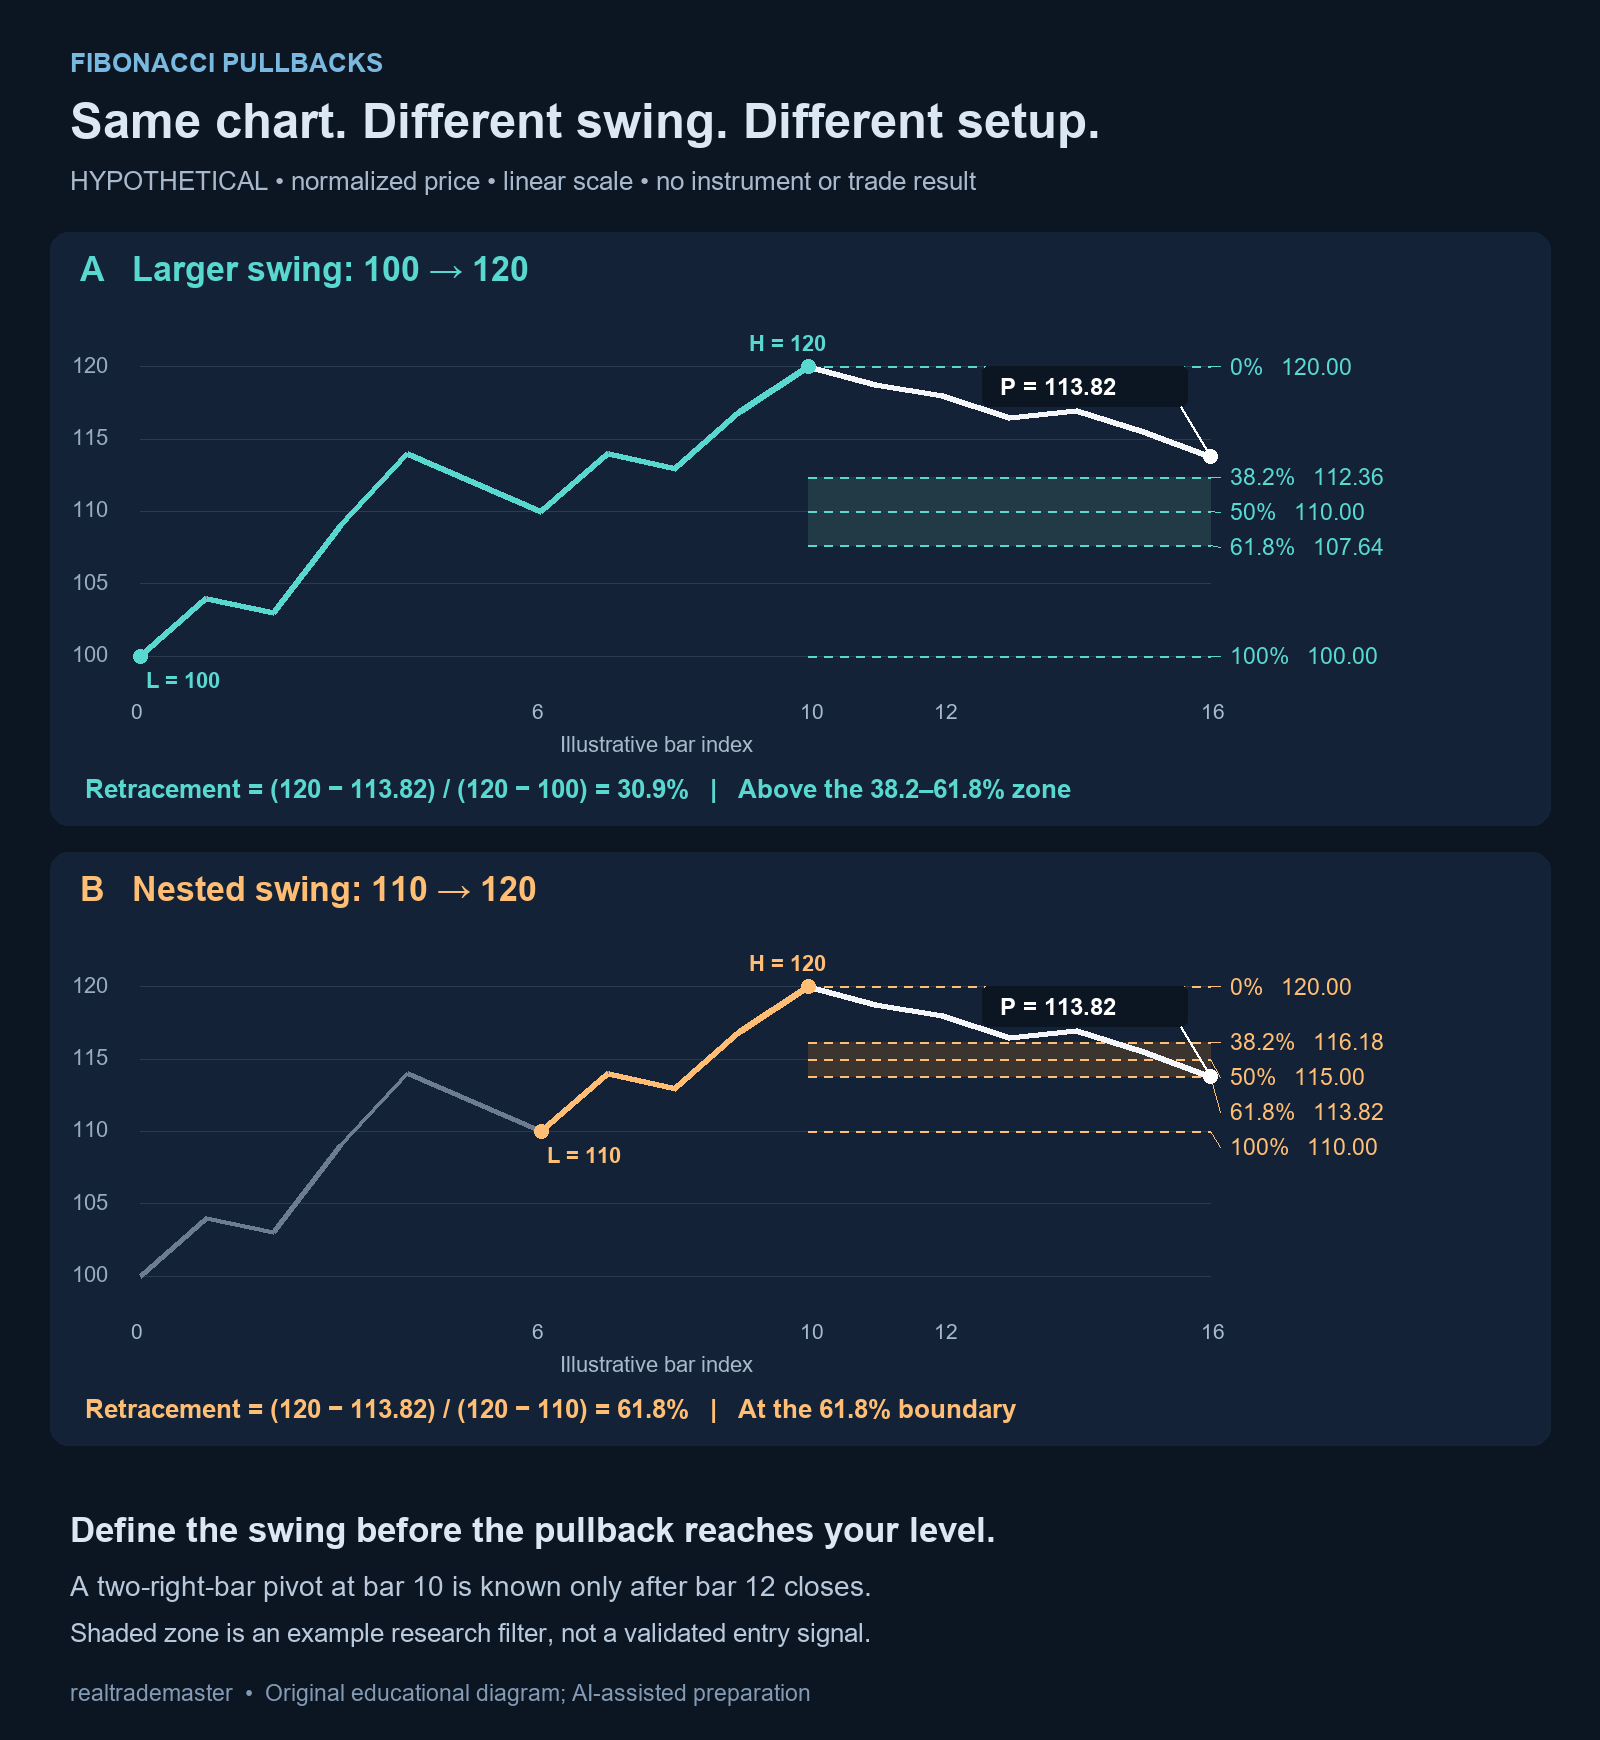
Both are right. They measured different moves.
For a linear upward swing, retracement fraction = (high − current) / (high − low). The high is 120 and the observation is 113.82, so the pullback is 6.18.
Anchor A: 100 → 120
6.18 ÷ 20 = 30.9%
38.2% level: 112.36
50% level: 110.00
61.8% level: 107.64
Anchor B: 110 → 120
6.18 ÷ 10 = 61.8%
38.2% level: 116.18
50% level: 115.00
61.8% level: 113.82
If you meant to study the larger swing's 38.2–61.8% zone, 113.82 has not reached it. Changing to the nested low after seeing a reaction changes the setup. A measured level is not an entry signal or a validated edge.
For a downward swing, a bounce level is low + fraction × (high − low). Check the drawing direction and price labels. The common 50% level is a midpoint convention, not a Fibonacci ratio.
View the original annotated answer chart
 Download annotated chart
The second trap: when could you know the high?
A local maximum defined by two lower observations on each side is only confirmed once both later observations exist. On this hypothetical path, the peak at index 10 is confirmable at index 12. Placing its label at 10 does not make it knowable then.
This dataset has one value per observation, not full OHLC candles. For a real test, specify timeframe, high/low or close convention, pivot width and tie handling separately. A rule based on future bars must respect its confirmation delay.
Freeze the rule before you test it.
- Select: choose the timeframe, price convention and swing-selection rule.
- Separate: define location, confirmation trigger, expiry and failure conditions. A zone touch alone proves none of these.
- Record: keep failed and missed candidates. Do not redraw an anchor to rescue an example.
- Compare: test a similarly wide non-Fibonacci zone with other rules held constant on untouched data. Specify execution, exits and costs separately.
These are research-design prompts, not a tested trading strategy. No profitable continuation has been added to the chart.
Run it in ten minutes.
Two minutes to mark the swings, two to calculate, two to reveal the answer, two to discuss confirmation delay, and two to write a consistent rule and a failure case. The answer guide contains the complete exercise.
Remix credit
“Adapted from the realtrademaster Open Puzzle Kit — AI-assisted original educational material.” Link to this page, retain the hypothetical-data label and identify your changes. Full permission.
Sources & scope
TradingView: Fibonacci drawing mechanics · TradingView: pivot definitions. The data, arithmetic and teaching exercise are our original illustrations; these sources do not endorse the kit.